3D Net Gamma Exposure Surface
1. Introduction
The 3D Net Gamma Exposure (GEX) Surface provides a multidimensional view of how dealer gamma exposure varies across strike prices, time to expiry, and implied volatility.
Instead of a single snapshot, it shows a dynamic landscape of how the market’s hedging pressure evolves in three dimensions.
This visualization helps traders see zones of positive and negative gamma, revealing where dealers are absorbing or amplifying price volatility.
2. Application
The Net Gamma Exposure Surface is typically computed by summing the gamma of all options (calls and puts) weighted by open interest and the notional exposure for each strike and expiry.
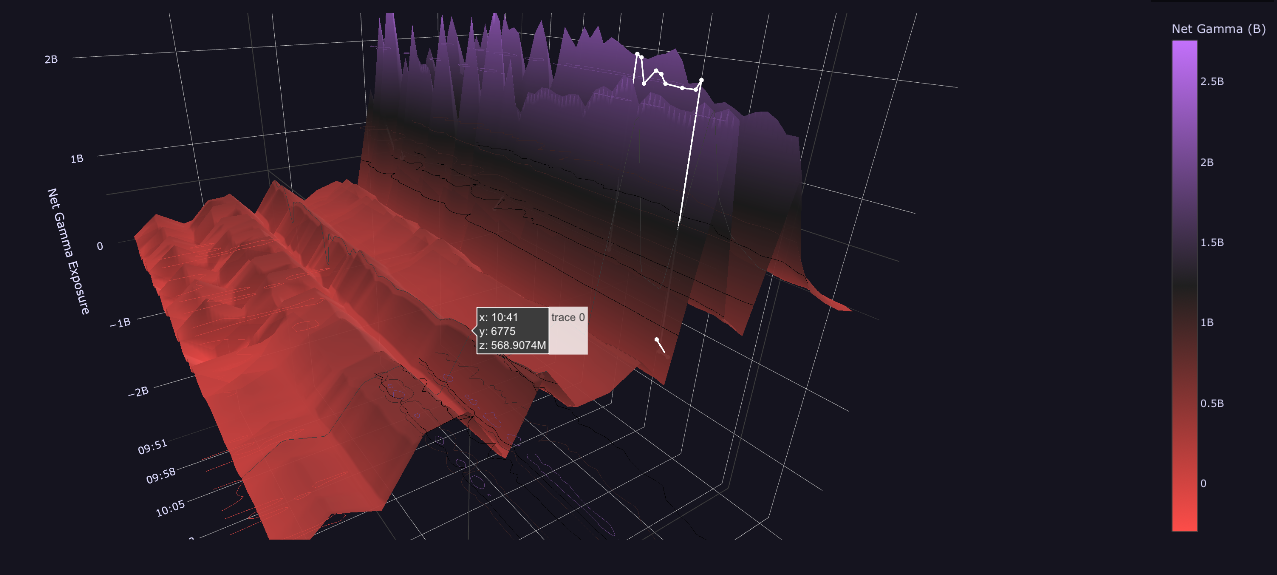
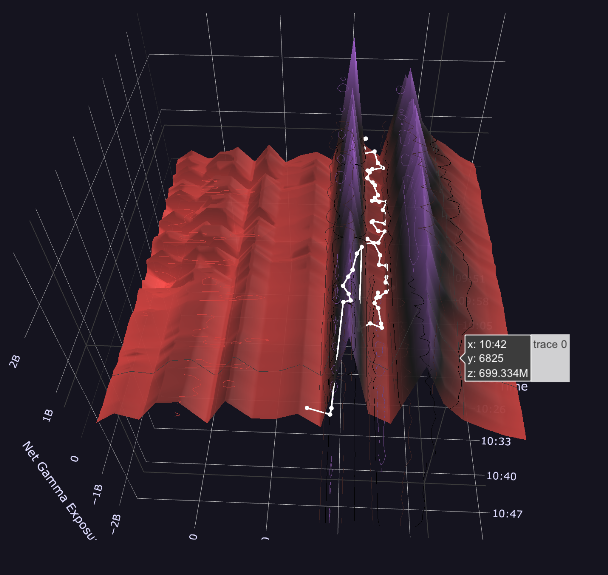
In 3D form:
- X-axis: Strike Price
- Y-axis: Time
- Z-axis: Net Gamma Exposure
Interpretation:
- High Positive GEX Areas: Dealers are long gamma → they hedge against market moves, stabilizing prices.
- High Negative GEX Areas: Dealers are short gamma → they hedge with the market, fueling volatility.
The shape and gradient of the surface reveal whether the market is in a controlled (positive gamma) or unstable (negative gamma) regime.
Traders use it to:
- Identify volatility pockets across expirations.
- Detect GEX inflection zones where market behavior may flip.
- Combine with implied volatility and volume data to gauge dealer positioning pressure.
3. Key Takeaways
- The 3D GEX surface offers a comprehensive volatility map of the market’s structure.
- Negative gamma zones often align with high-volatility selloffs or sharp reversals.
- Tracking GEX shifts across expirations helps anticipate liquidity absorption vs. release.
- A steep gradient near spot suggests sensitivity to hedging flows and potential gamma-driven swings.