Implied Volatility
1. Introduction
Implied Volatility (IV) represents the market’s expectation of future price movement for the underlying asset.
It’s derived from option prices using models like Black-Scholes, but instead of predicting volatility, it reveals what the market is pricing in.
High IV means options are expensive because traders expect larger moves; low IV means options are cheaper, implying calmer markets.
Importantly, IV does not predict direction — it reflects magnitude of expected movement.
2. Application
Implied Volatility affects option premiums, hedging cost, and expected range of movement.
Each option (call or put) has its own IV, but traders typically analyze IV levels across strikes (smile/skew) and across expirations (term structure).
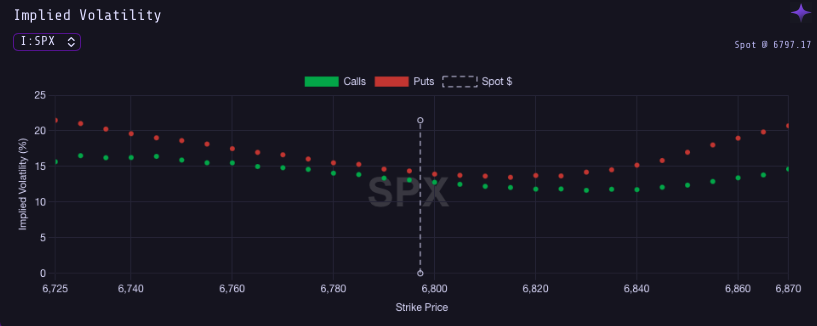
2.1. Call vs Put Implied Volatility
- Calls often have lower IV when the market is stable or bullish.
- Puts usually carry higher IV due to demand for downside protection.
This creates a volatility skew — higher IV on puts, lower on calls — especially in indices like SPX.
2.2. Other IV Metrics
Common IV metrics:
- IV Rank (IVR): Compares current IV to its 1-year range.
IVR = (Current IV – 1Y Low) / (1Y High – 1Y Low) × 100
- IV Percentile (IVP): Percentage of time IV was below current level.
Interpretation:
- High IVR (>70%) → Options are expensive; short volatility strategies (like credit spreads) become attractive.
- Low IVR (<30%) → Options are cheap; long volatility strategies (like straddles) may offer better risk/reward.
2.3. IV and Realized Volatility
Comparing implied vs realized volatility (actual price movement) helps traders gauge if options are overpriced or underpriced.
Persistent IV > Realized Vol means markets overpay for protection, common in indices.

3. Key Takeaways
- Implied Volatility shows expected market uncertainty, not direction.
- Puts tend to have higher IV due to downside protection demand.
- Use IV Rank and IV Percentile to evaluate option value and timing.
- Comparing IV to Realized Volatility helps detect overpriced premiums.
- IV structure (smile/skew) reveals fear asymmetry in the market.